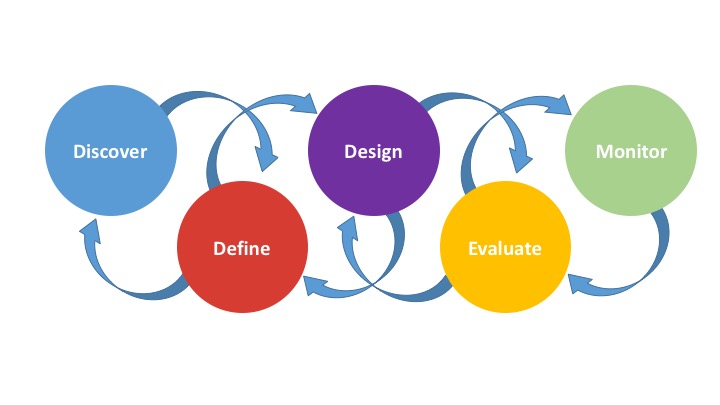
My UX Research and Design Cycle
SOLUTION HIGHLIGHTS
Innovative Approach in Developing Next-Generation Mass Casualty Incident Management
Problem
At the time of the mass casualty incidents, information provided by the Paramedics, Medical Administrators and Medical Doctors needs to be effectively analyzed and presented through intelligent user interfaces. Such interfaces need to be easy-to-use by ICs to foster critical decisions that can potentially reduce mortality rates.
My Role
Sr. User Experience Researcher and Designer
Solution:
This system has been iteratively developed and refined based on user experience research driven methodology that employed a mixed methods approach, including the views of clinical experts, paramedics and health professionals. Panacea’s Cloud. is an example of a next generation MCI system that has an intelligent dashboard that integrates Internet-of-Things (IoT) technologies such as wearable devices and augmented reality technology (AR), virtual beacons, and sensor network nodes.
Methods Employed and Iterations:
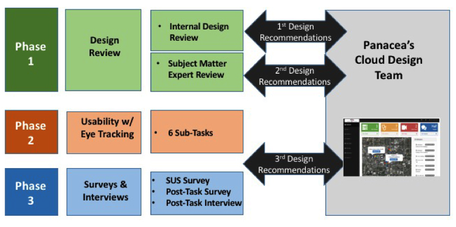
Iteration 1: Design Review (Phase 1)
The design review was conducted by two medical experts and three usability experts. Its goal was to provide feedback for helping the developers create a more resilient system based on the research findings. Additionally, three usability experts conducted a design review that was inspired by Nielsen’s Heuristics (Nielsen, 1994). Additional recommendations for improvements were then provided.
Iteration 2: Usability Evaluation with the Eye Tracking (Phases 2 and 3)
We created a disaster scenario derived from the major tasks at the time of a disaster. The participants were given no time-limit tasks. A total of 10 users conducted a usability test using eye-tracking methods. Eye-tracking technology was used to measure efficiency and effectiveness which helped the researchers to better understand what users were looking at and how much time they spent while browsing and completing the tasks by recording the users’ eye gaze movements (Demir, Karakaya, & Tosun, 2012). We analyzed (a) task completion success (effectiveness), (b) task completion time (efficiency), (c) total visit time by page and by areas of interest (AOI), (d) participants’ browsing patterns, and (e) heat maps of the index page. The remote eye tracker was a Tobii system installed on a Dell brand laptop. Stimuli were presented on a 14.4-inch monitor at a resolution of 1024 x 768 pixels and with a refresh rate of 60 Hz.
Think aloud
The task completion test involved the observation of participants’ interactions with the computer during their tasks and the collection of their think-aloud comments about the system (Boren & Ramey, 2000; Nielsen, 1992). We studied participants’ preferences, how they dealt with the system, and opinions (Nielsen, Clemmensen, & Yssing, 2002). Participants were asked to describe their impressions and experiences with the Panacea’s Cloud™. Participants were asked to comment on difficulties that they faced when completing the tasks and were asked to offer suggestions regarding the design and functionality of the system.
User satisfaction survey (SUS)
We collected data in order to measure users’ satisfaction using the System Usability Scale (SUS; Bangor, Kortum, & Miller, 2008; Lewis & Sauro, 2009). Participants were given the SUS directly after completing the session with the six tasks. SUS is a 10-item Likert scale designed to measure users’ subjective satisfaction level (Lewis & Sauro, 2009). The SUS survey was applied to measure the user’s subjective satisfaction level with the Panacea’s Cloud™ system.
Post-study survey and interview
Following the SUS, a post-study survey was conducted to gather dashboard users’ experiences. It was clustered in two parts. The majority of the items were reported on a 5-point Likert response, which is a widely used item-scoring scheme to quantify participants’ opinions and interests (Bishop & Herron, 2015). Part 1 consisted of demographic variables, for example, age of participants and experience in use of technology. Part 2 included 10 questions regarding participants’ previous experiences during the mass casualty exercise and thoughts about the Panacea’s Cloud’s™ features: for example, Item #4 “The audio/video feeds significantly improve my ability to triage mass casualties over my current communication” and Item #5 “The real-time location mapping of patients and staff significantly improves my ability to triage mass casualties over my current communication methods.” Part 3 included five open interview questions such as final thoughts about the system design, terminology used, and recommendations.
Selection of participants
We invited 15 health professionals from the University of Missouri Hospital’s Level One Trauma Center to participate in this study. A total of 10 users agreed to participate in the study. Inclusion criteria were a range of job experiences, specialization, experience in using digital
Conclusion
The usability testing of the system revealed that audio/visual communications between ICs and paramedics help in managing the incidents and in correctly triaging the patients. A dashboard with a synchronous map that hosts real-time tracking data of patients and paramedics provides visual cues for dashboard users and thus fosters ease-of-management of the incident. It is also understood from the research that ICs don’t want to browse back and forth through the website to accomplish the tasks, thus main functions for all major tasks should be hosted on the main dashboard page so as to allow users fast browsing of datasets. Additionally, appropriate terminology should be used consistently throughout the system. Icon-based simplistic designs help dashboard users capture the circumstances easily by reducing the cognitive workload. User-centered design approaches have a great impact on the acceptability of such complex interactive services, thus refinements for the next design cycle with user-centered design principles are needed to provide best tasks achievement aligned with user satisfaction. The performance of the network system might be affected by many factors particularly during MCIs, consequently it is important to consider creating a reliable Wi-Fi network for system to function properly.
Next generation MCI systems should also provide a system for appropriate triage, monitoring of patients and paramedics on-scene, that does not overwhelm hospitals and provides for effective use of resources.
See details in Journal of Usability Studies
uxpajournal.org/augmented-reality-casualty-incidents/
Problem
At the time of the mass casualty incidents, information provided by the Paramedics, Medical Administrators and Medical Doctors needs to be effectively analyzed and presented through intelligent user interfaces. Such interfaces need to be easy-to-use by ICs to foster critical decisions that can potentially reduce mortality rates.
My Role
Sr. User Experience Researcher and Designer
Solution:
This system has been iteratively developed and refined based on user experience research driven methodology that employed a mixed methods approach, including the views of clinical experts, paramedics and health professionals. Panacea’s Cloud. is an example of a next generation MCI system that has an intelligent dashboard that integrates Internet-of-Things (IoT) technologies such as wearable devices and augmented reality technology (AR), virtual beacons, and sensor network nodes.
Methods Employed and Iterations:
- Mixed method design
- Literature Review
- Design review
- Expert review
- Heuristic evaluation
- Eye-tracking
- Recruitment
- In-person moderated usability testing
- Think aloud protocol
- User satisfaction survey
- Post-task survey
- In-depth interview
- User persona development
- Documentation and research reporting
Iteration 1: Design Review (Phase 1)
The design review was conducted by two medical experts and three usability experts. Its goal was to provide feedback for helping the developers create a more resilient system based on the research findings. Additionally, three usability experts conducted a design review that was inspired by Nielsen’s Heuristics (Nielsen, 1994). Additional recommendations for improvements were then provided.
Iteration 2: Usability Evaluation with the Eye Tracking (Phases 2 and 3)
We created a disaster scenario derived from the major tasks at the time of a disaster. The participants were given no time-limit tasks. A total of 10 users conducted a usability test using eye-tracking methods. Eye-tracking technology was used to measure efficiency and effectiveness which helped the researchers to better understand what users were looking at and how much time they spent while browsing and completing the tasks by recording the users’ eye gaze movements (Demir, Karakaya, & Tosun, 2012). We analyzed (a) task completion success (effectiveness), (b) task completion time (efficiency), (c) total visit time by page and by areas of interest (AOI), (d) participants’ browsing patterns, and (e) heat maps of the index page. The remote eye tracker was a Tobii system installed on a Dell brand laptop. Stimuli were presented on a 14.4-inch monitor at a resolution of 1024 x 768 pixels and with a refresh rate of 60 Hz.
Think aloud
The task completion test involved the observation of participants’ interactions with the computer during their tasks and the collection of their think-aloud comments about the system (Boren & Ramey, 2000; Nielsen, 1992). We studied participants’ preferences, how they dealt with the system, and opinions (Nielsen, Clemmensen, & Yssing, 2002). Participants were asked to describe their impressions and experiences with the Panacea’s Cloud™. Participants were asked to comment on difficulties that they faced when completing the tasks and were asked to offer suggestions regarding the design and functionality of the system.
User satisfaction survey (SUS)
We collected data in order to measure users’ satisfaction using the System Usability Scale (SUS; Bangor, Kortum, & Miller, 2008; Lewis & Sauro, 2009). Participants were given the SUS directly after completing the session with the six tasks. SUS is a 10-item Likert scale designed to measure users’ subjective satisfaction level (Lewis & Sauro, 2009). The SUS survey was applied to measure the user’s subjective satisfaction level with the Panacea’s Cloud™ system.
Post-study survey and interview
Following the SUS, a post-study survey was conducted to gather dashboard users’ experiences. It was clustered in two parts. The majority of the items were reported on a 5-point Likert response, which is a widely used item-scoring scheme to quantify participants’ opinions and interests (Bishop & Herron, 2015). Part 1 consisted of demographic variables, for example, age of participants and experience in use of technology. Part 2 included 10 questions regarding participants’ previous experiences during the mass casualty exercise and thoughts about the Panacea’s Cloud’s™ features: for example, Item #4 “The audio/video feeds significantly improve my ability to triage mass casualties over my current communication” and Item #5 “The real-time location mapping of patients and staff significantly improves my ability to triage mass casualties over my current communication methods.” Part 3 included five open interview questions such as final thoughts about the system design, terminology used, and recommendations.
Selection of participants
We invited 15 health professionals from the University of Missouri Hospital’s Level One Trauma Center to participate in this study. A total of 10 users agreed to participate in the study. Inclusion criteria were a range of job experiences, specialization, experience in using digital
Conclusion
The usability testing of the system revealed that audio/visual communications between ICs and paramedics help in managing the incidents and in correctly triaging the patients. A dashboard with a synchronous map that hosts real-time tracking data of patients and paramedics provides visual cues for dashboard users and thus fosters ease-of-management of the incident. It is also understood from the research that ICs don’t want to browse back and forth through the website to accomplish the tasks, thus main functions for all major tasks should be hosted on the main dashboard page so as to allow users fast browsing of datasets. Additionally, appropriate terminology should be used consistently throughout the system. Icon-based simplistic designs help dashboard users capture the circumstances easily by reducing the cognitive workload. User-centered design approaches have a great impact on the acceptability of such complex interactive services, thus refinements for the next design cycle with user-centered design principles are needed to provide best tasks achievement aligned with user satisfaction. The performance of the network system might be affected by many factors particularly during MCIs, consequently it is important to consider creating a reliable Wi-Fi network for system to function properly.
Next generation MCI systems should also provide a system for appropriate triage, monitoring of patients and paramedics on-scene, that does not overwhelm hospitals and provides for effective use of resources.
See details in Journal of Usability Studies
uxpajournal.org/augmented-reality-casualty-incidents/
Proposing Solutions to Develop Strategic Improvement Plans in Public Schools
Problem
The schools in the United States undergo reforms that involve the integration of data-intensive improvement process known as Strategic Improvement Plans (SIP) requires digital systems to set goals, create interventions, use and analyze student data, monitor, and report SIPs. A challenge with digital systems is the integration of a highly diverse set of data sources and identifying users who will actually work with the new processes.
My Role: Sr. User Experience Researcher and Designer
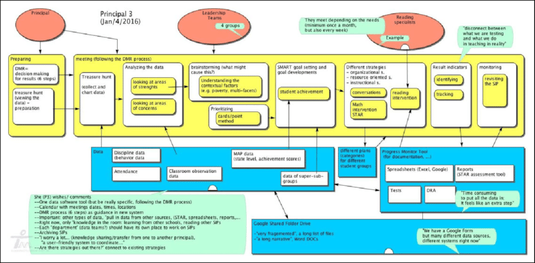
Method Employed
We applied the Sociotechnical Walkthrough, a qualitative method that combines a modeling notation and focuses groups’ interviews to understand the current workflows, technology use, and interactions of teachers and principals in the processes of strategic improvement planning.
Conclusion
The results show a shared understanding and integrated view of different participants that help to identify and to promote the development of a new socio-technical system or making adjustments to existing systems (Herrmann et al., 2007). By applying this method, our results have shown the richness, overlaps, and differences of current SIPs in schools as well as the challenges schools encounter when implementing SIPs. Finally, we identified major design recommendations that may help to develop a new ‘coherent whole’ toward a new sociotechnical SIP system in schools including its underlying processes and roles.
See details in Journal of Management in Education
https://doi.org/10.1177/0892020619847681
Problem
The schools in the United States undergo reforms that involve the integration of data-intensive improvement process known as Strategic Improvement Plans (SIP) requires digital systems to set goals, create interventions, use and analyze student data, monitor, and report SIPs. A challenge with digital systems is the integration of a highly diverse set of data sources and identifying users who will actually work with the new processes.
My Role: Sr. User Experience Researcher and Designer
Method Employed
- Qualitative UX research
- Literature Review
- Sociotechnical Walkthrough
- User persona development
- Recruitment
- In-person moderated usability testing
- Remote moderated usability testing
- Think aloud protocol
- User satisfaction survey
- Post-task survey
- Focus group interview
- Documentation and research reporting
We applied the Sociotechnical Walkthrough, a qualitative method that combines a modeling notation and focuses groups’ interviews to understand the current workflows, technology use, and interactions of teachers and principals in the processes of strategic improvement planning.
Conclusion
The results show a shared understanding and integrated view of different participants that help to identify and to promote the development of a new socio-technical system or making adjustments to existing systems (Herrmann et al., 2007). By applying this method, our results have shown the richness, overlaps, and differences of current SIPs in schools as well as the challenges schools encounter when implementing SIPs. Finally, we identified major design recommendations that may help to develop a new ‘coherent whole’ toward a new sociotechnical SIP system in schools including its underlying processes and roles.
See details in Journal of Management in Education
https://doi.org/10.1177/0892020619847681
Selected Methods Employed for Product Design
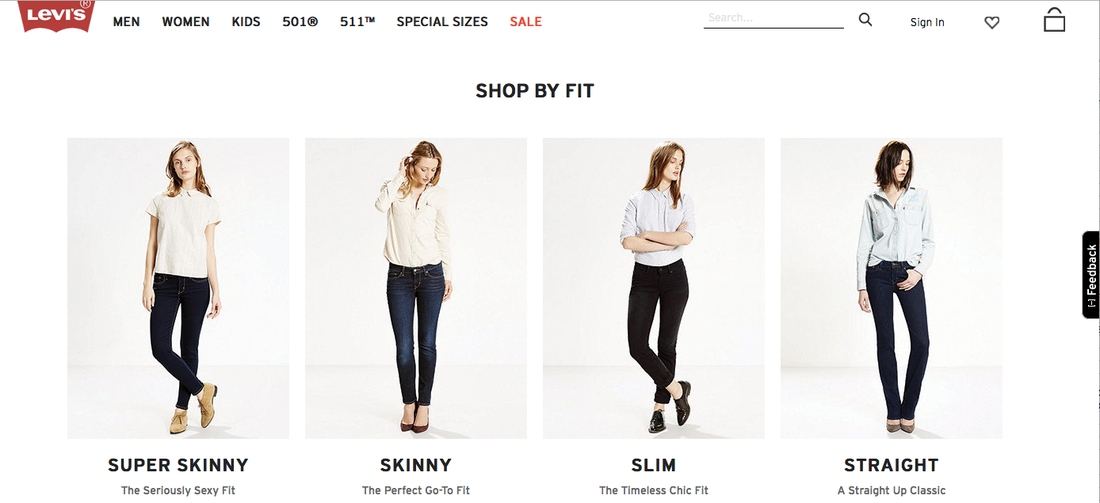
Levi.com, has decided to have its web site redesigned to address the needs of users who visit the site to buy their products. I used various research methods including participatory design and image collaging to discover users' needs and expectations and to design for levi's to reach better outcomes.
User Perception and Needs Assessment
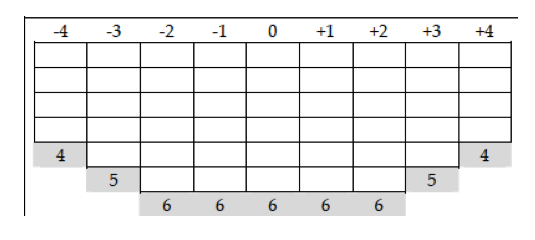
In addition to the well known UX research methods, I use Q method to discover the perceptions and priorities of the users. The Q method is a method easily applied during interviews to gain a deeper understanding of the subjective needs assessment of the participants. I create statement sentences posing ideas for users to accept or decline. The Q method forces participants to place the statement sentences by prioritizing their subjective beliefs. The research results indicates consensus, disagreements and priorities of the users.
In addition to the well known UX research methods, I use Q method to discover the perceptions and priorities of the users. The Q method is a method easily applied during interviews to gain a deeper understanding of the subjective needs assessment of the participants. I create statement sentences posing ideas for users to accept or decline. The Q method forces participants to place the statement sentences by prioritizing their subjective beliefs. The research results indicates consensus, disagreements and priorities of the users.
Workflow and Mind Modeling
Understanding users' complex workflow is a challenging task for UX researcher and designers. However it is crucial visualization of the workflow to identify users' needs, expectations, pain points, and challenges. SeeMe Modeling allows visualization of the workflow addressing the stakeholders engaged in the process, activities completed or willing to be completed by all users, and entities that are required to run a system.
Understanding users' complex workflow is a challenging task for UX researcher and designers. However it is crucial visualization of the workflow to identify users' needs, expectations, pain points, and challenges. SeeMe Modeling allows visualization of the workflow addressing the stakeholders engaged in the process, activities completed or willing to be completed by all users, and entities that are required to run a system.
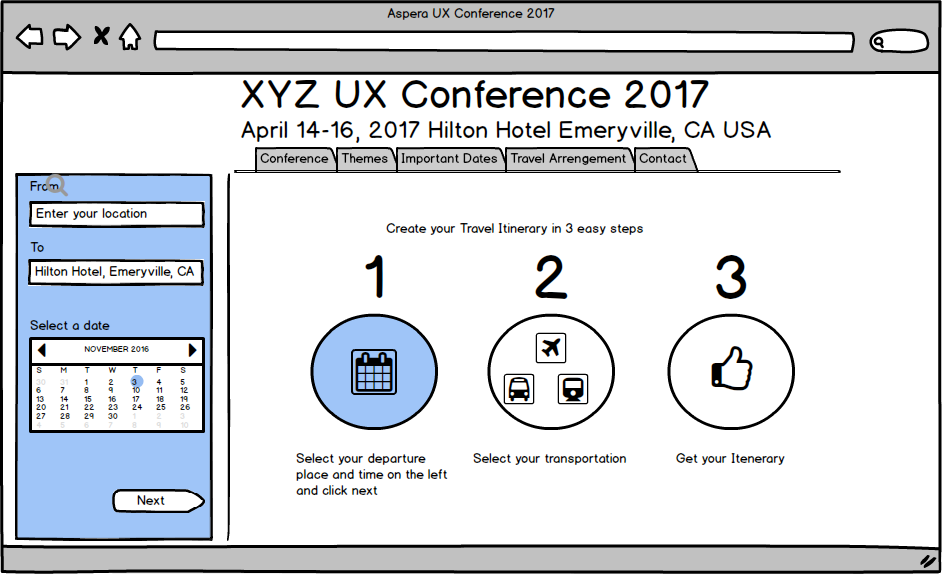
Prototype
Once the team has reached consensus on a model that can work best for the target audience, I start developing sketches, paper prototyping, I design a low/medium/high fidelity prototype for iterative design and early usability testing.
Once the team has reached consensus on a model that can work best for the target audience, I start developing sketches, paper prototyping, I design a low/medium/high fidelity prototype for iterative design and early usability testing.
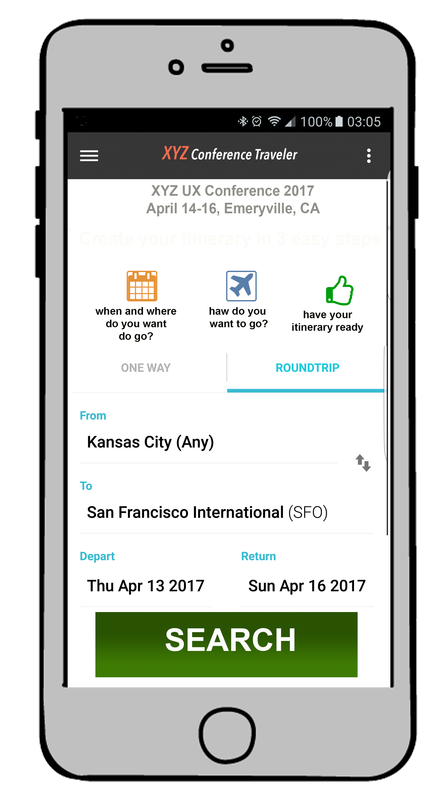
Mock-Up Design
Based on the research results, key issues, users' needs inform my mock-up design. Mock-up design helps researchers to test the initial design ideas with low cost and quickly. |
|
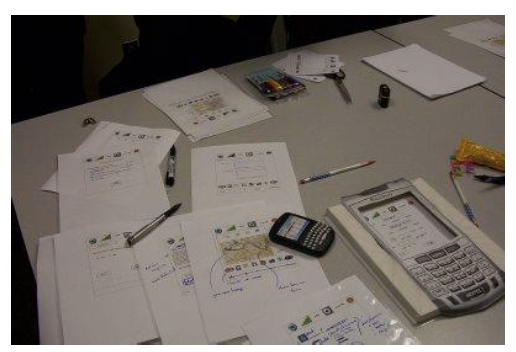
Participatory Design
By following the user centered design philosophy, the Participatory Design (PD) aimed to create a collaboration between designers and users during the designing process of an interface. Users’ satisfaction is one of the key factors that denotes the success of a product and the PD methodology seeks users satisfaction during the designing activity.
By following the user centered design philosophy, the Participatory Design (PD) aimed to create a collaboration between designers and users during the designing process of an interface. Users’ satisfaction is one of the key factors that denotes the success of a product and the PD methodology seeks users satisfaction during the designing activity.
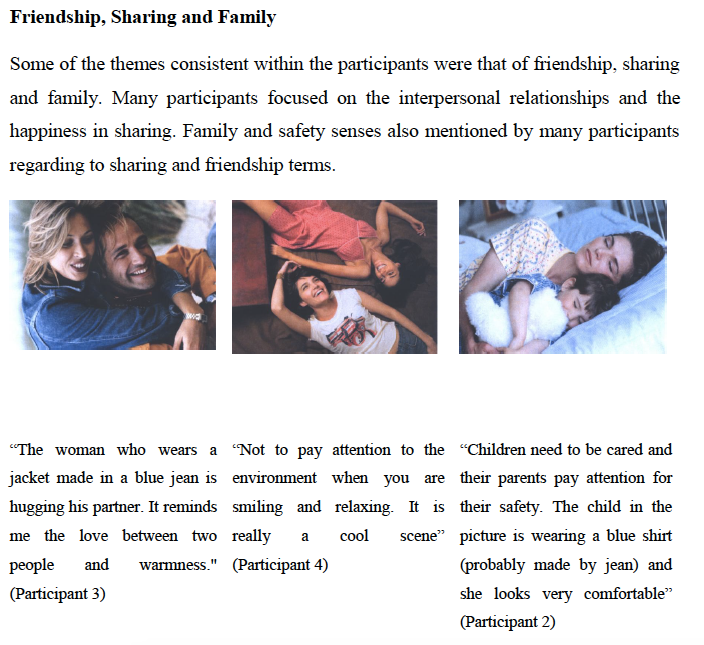
Image Collaging
Image collaging is a method to gather information about users’ thoughts on a particular concept. Series of pictures would offered to the participant to pick and talk about some positive and negative sides of the picture and how she adopt the story shown on the picture to the concept. Participants are asked to pick some pictures to talk about positive sides and some for negative. |
|
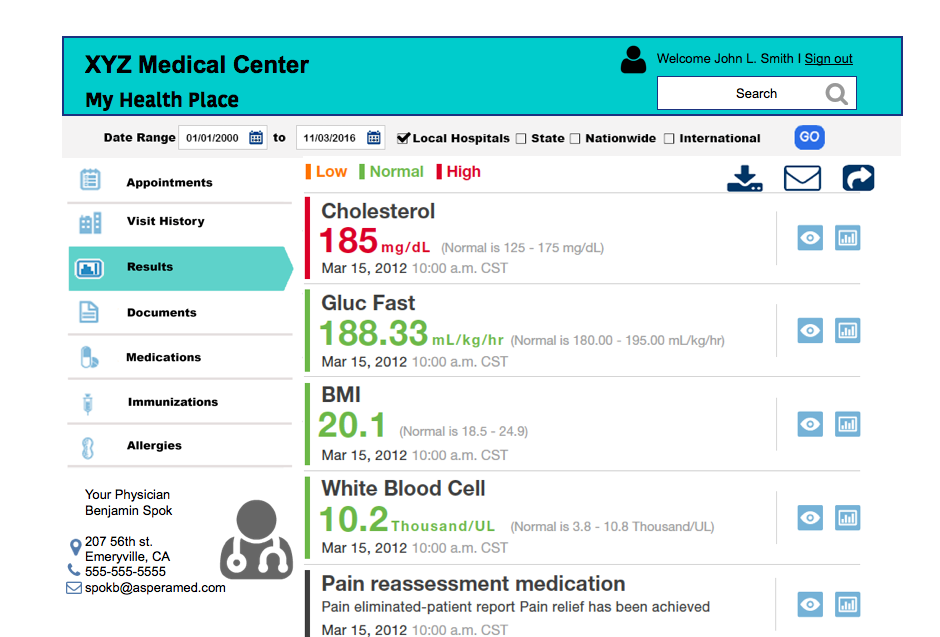
TASK ANALYSIS WITH EYE TRACKING RESEARCH
|
I used eye tracking research method to discover how physicians retrieve information on designated applications. Eye tracking is a method to track the eye gaze movements of the participants to detect cues that may affect the reasoning process. The eye tracking system captures eye gaze movements during the task and record visually where on screen are inspected, therefore, researchers may analyze the decision making process. It produces both quantitative and qualitative data.
|
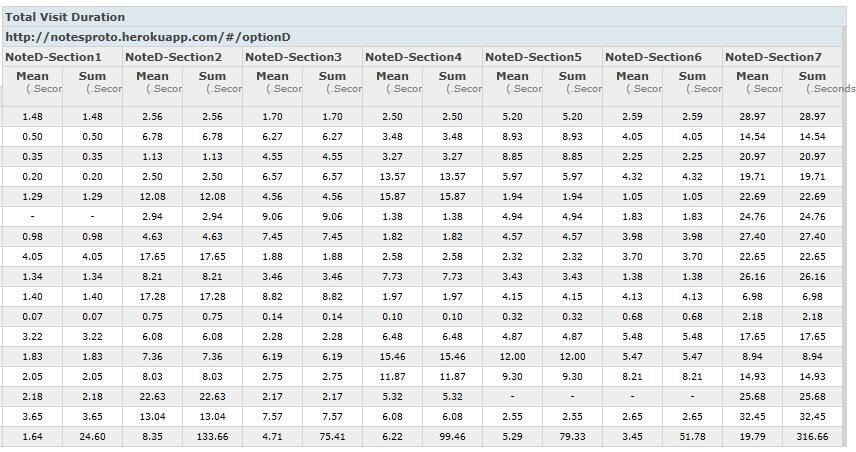
Total visit duration, visit count, total fixation duration are some of the data that Eye Tracking system provides to understand and analyze users' behaviors.
|
UX DELIVERABLES
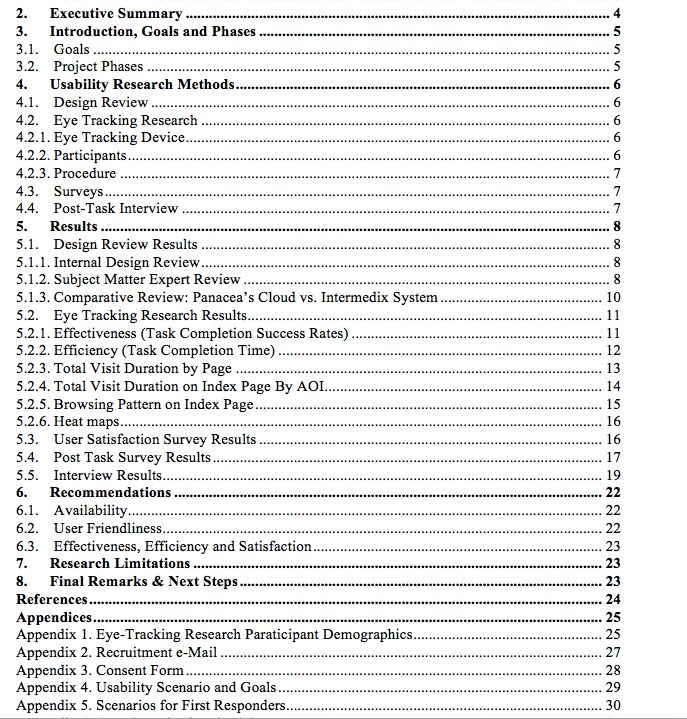
Usability research plays a significant role in the resilience of the products. The main goal of the current usability research was thus to analyze effectiveness and efficiency of the product and find out problems that may affect user satisfaction and ease-of-use. The UX Deliverables such as client reports inform clients about the identified problems and make suggestions for further development. The UX deliverables mainly aims;
- Identifying design problems
- Evaluating the existing system
- Measuring the effectiveness and efficiency of the system
- Measuring the end users’ overall satisfaction with the system
- Deriving test participants’ recommendations regarding to the interface design and the system
LITERATURE REVIEW
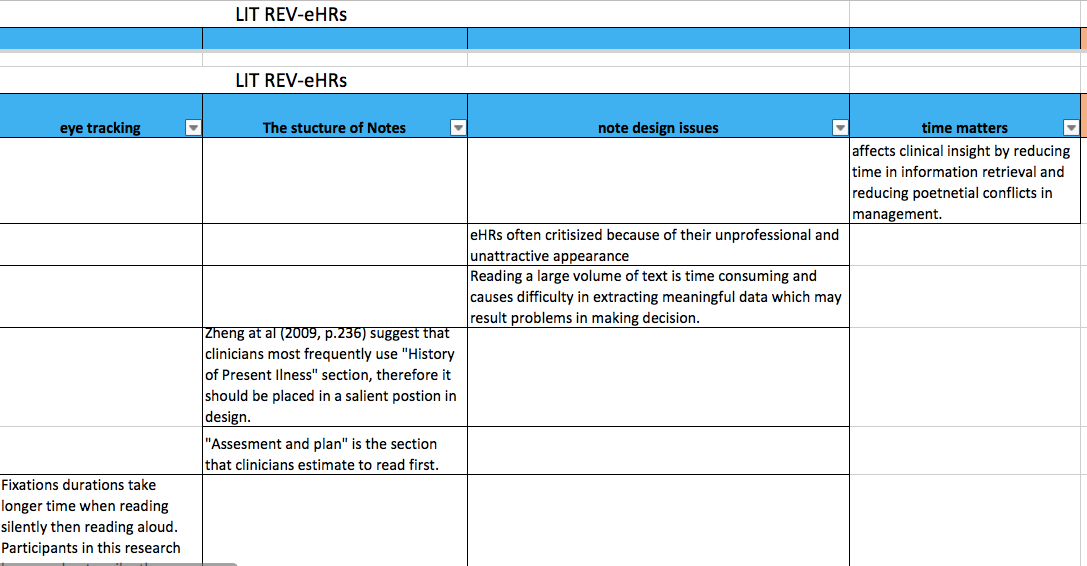
I review literature for the benefits of clients to learn more about the main problems, issues and proposed solutions in a particular area. Some of the publications represent some of the best practices thinking on UI and UX design.
Futuristic UX Design
WEB SITE
Before the UX Evaluation
|
After the UX Evaluation
|